Navigating Reports
The Know Your Data Advanced Reports includes maps and charts that provide data snapshots, and a Build A Table section that allows users to filter data, drill-down to district- and school-levels, and disaggregate by student demographics and other school-level indicators.
Reports in the tool can contain multiple related reports in one. If multiple reports are included, you can navigate to the different reports using the top navigation tabs.
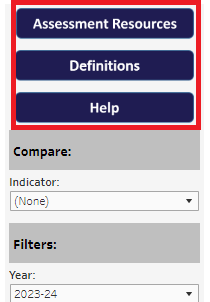
- Click on the desired tab button to navigate to a different type of report for the topic.
- Resources: Links to additional report topic information.
- Definitions: Links to definitions of common terms used in the reports.
- FAQs: Links to Frequently Asked Questions on select reports for the report topic.
- Guide to Calculation: Links to additional information on select reports (example: High School Graduation) about calculation used in the report.
-
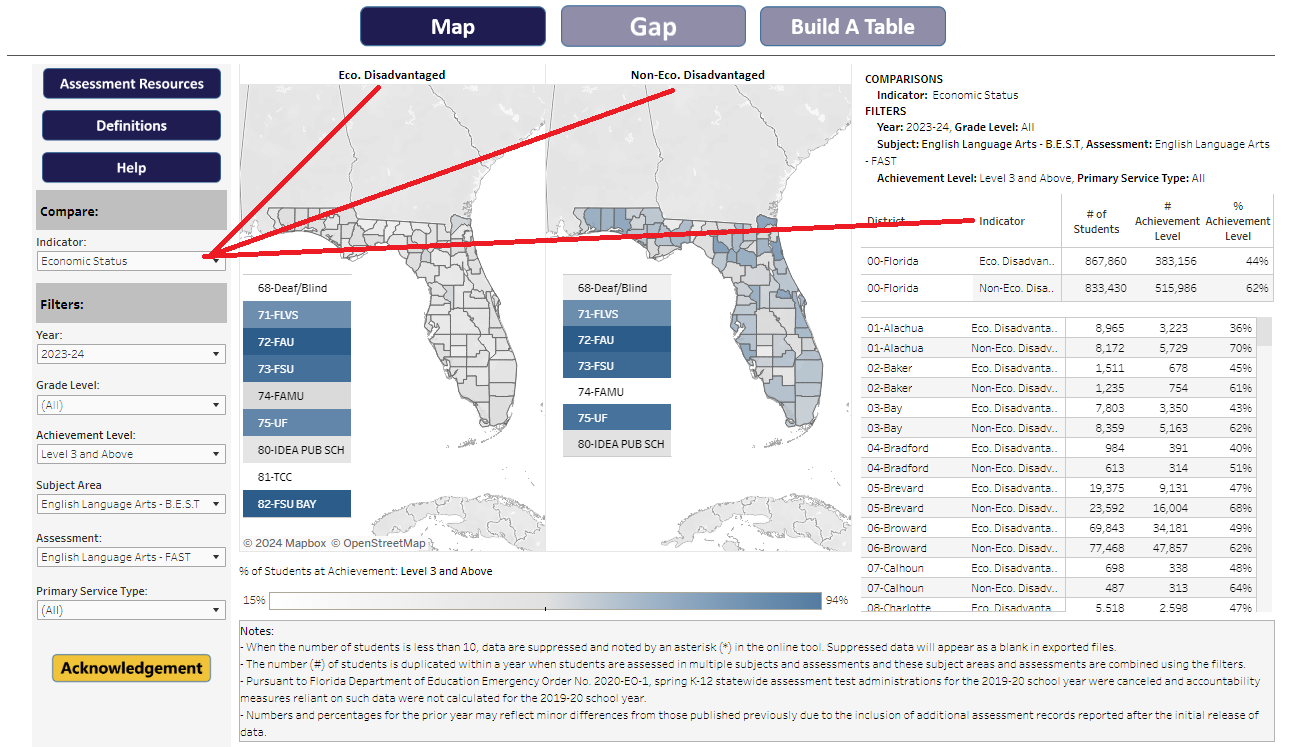
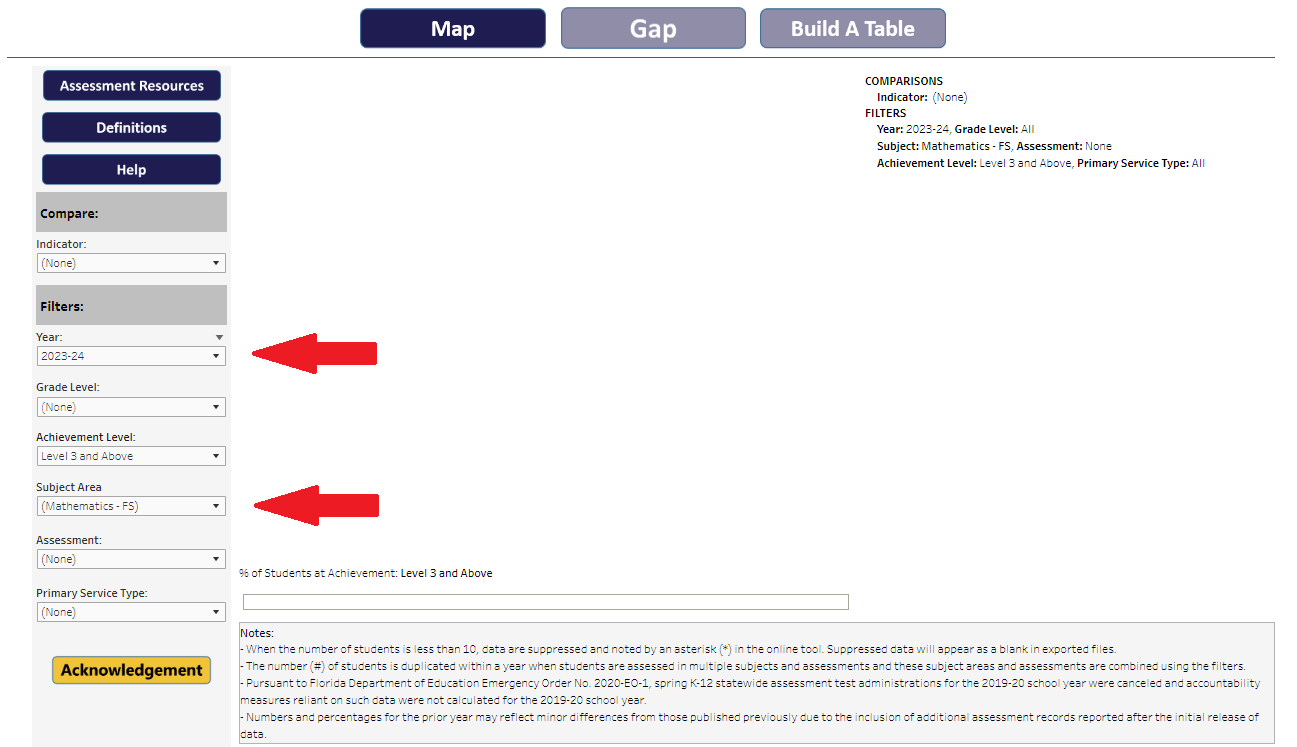
Compare/Indicators: Dropdown lists that allow users to select student demographic indicators/breakdowns and view side-by-side comparisons in maps, charts, and tables.
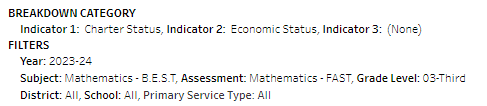
- Filters: Radio buttons, dropdown lists, or static lists allow users to select and filter the charts and tables to focus on specific years, grade levels, subject areas, assessments, achievement levels, and more. Selected comparison indicators and filters are reflected in the title section of the maps, charts, and tables.
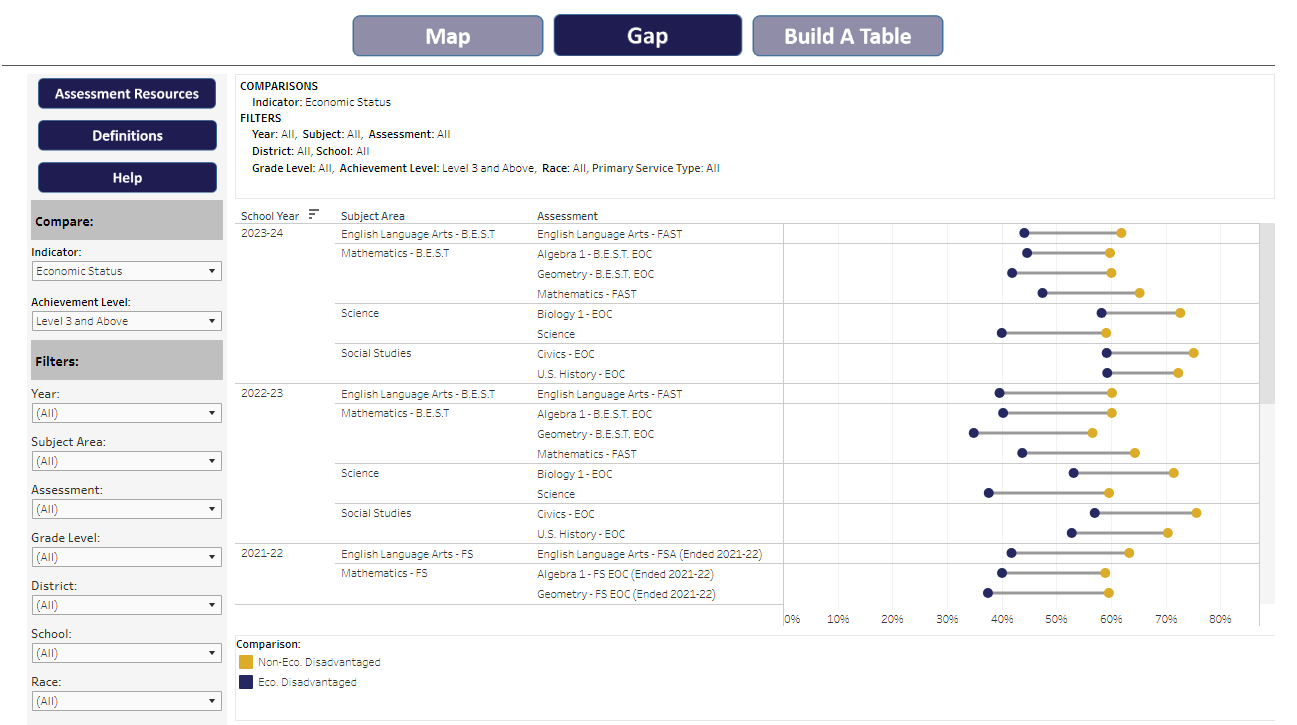
Charts
Some Tableau reports contain additional sections with charts that highlight information. These charts are customizable by using the comparison indicators and filters in the left-hand navigation. The chart titles are responsive and indicate the selections.
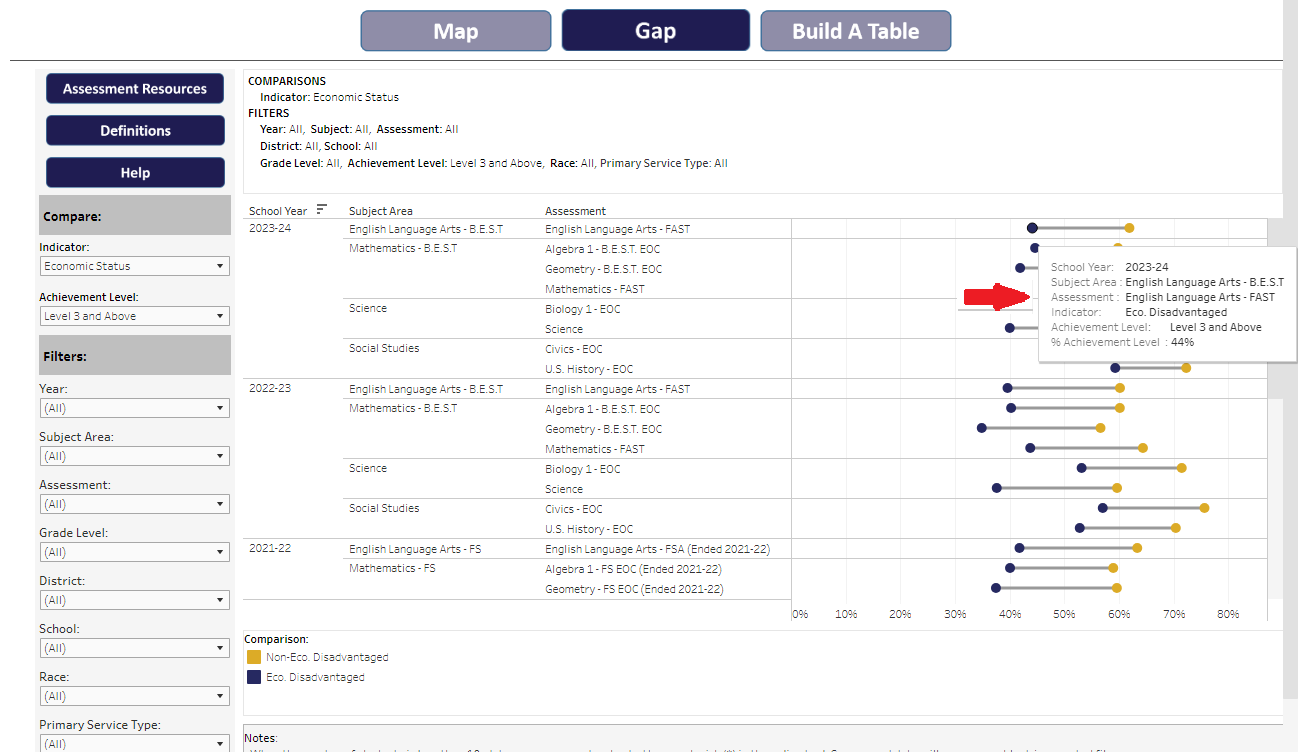
Tool Tips
- Hover over a data point to show the tool tip that reflects the selections made in the left-hand navigation and the associated number/percentage.
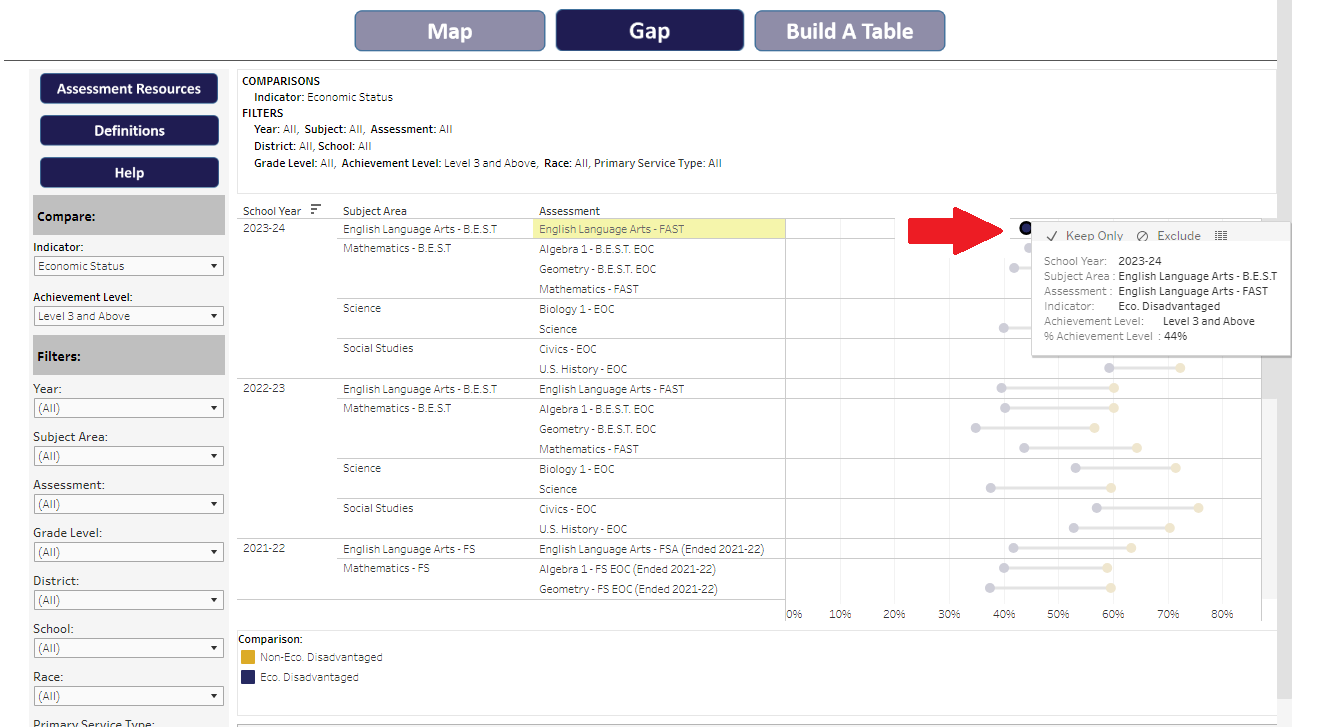
Exclude/Include
- Click on a data point in the charts to remove data by selecting Exclude or to isolate data by selecting Keep Only in the chart.
-
Use one of the following options to revert a change made to a chart or table:
- Undo button: Select this option to go backwards one step at a time.
- Revert button: Select this option to remove all changes and revert the view to its original state.
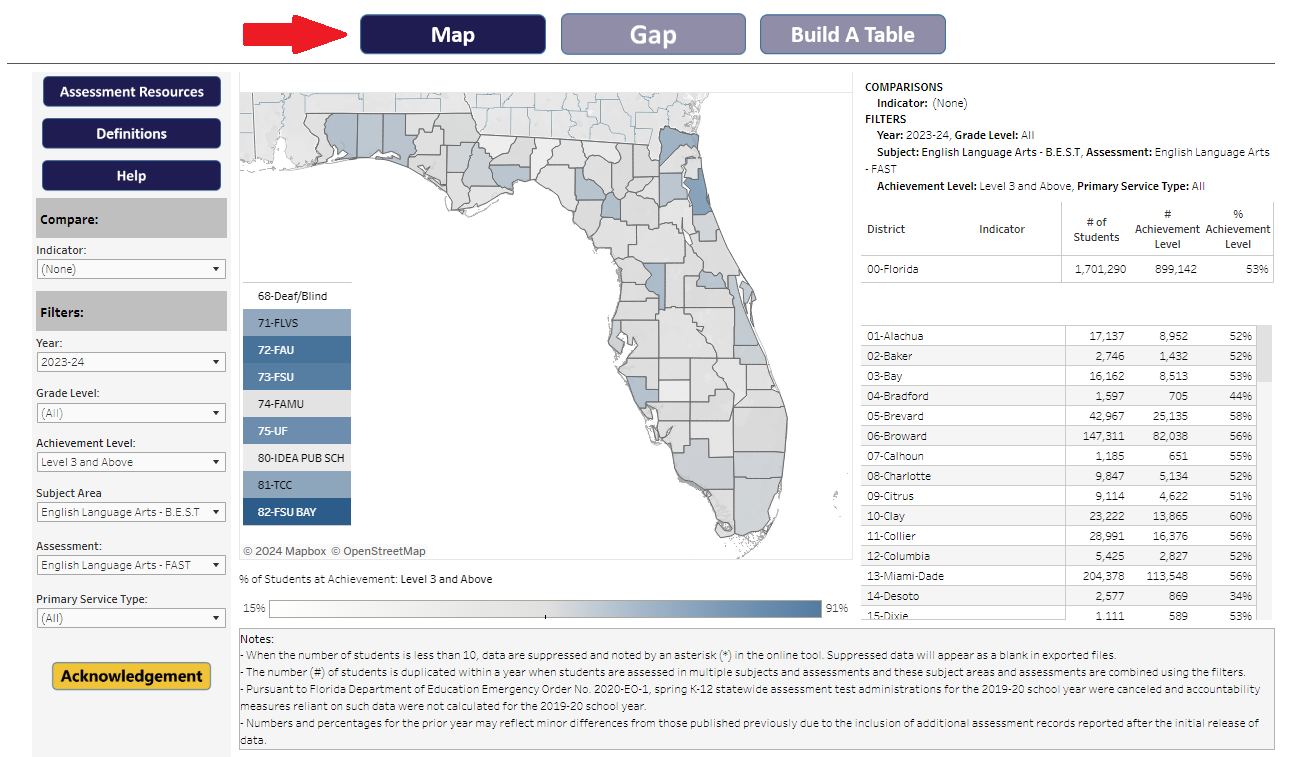
Maps
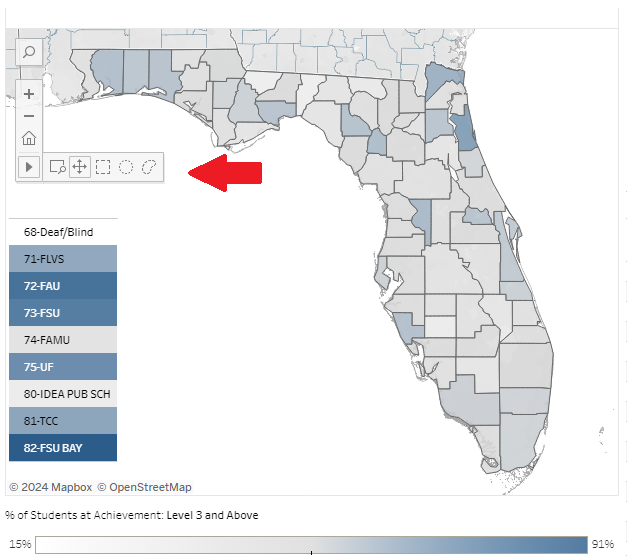
Map Toolbar
The map toolbar allows users to zoom in and out, pan, and use the rectangular, radial, and lasso tools to select areas on the map.
- Hover over a map to show the map toolbar.
-
Hover over the right arrow
 in this toolbar to view all of its functions.
- District Map Filter : Click on a district in the map to filter the data for a specific district.
-
Reset Map: Use the Home button
 in the toolbar to return the map to its original setting.
- Tooltips: Hover over the map to view additional information. This feature assists users with navigating the interactive features of the map.
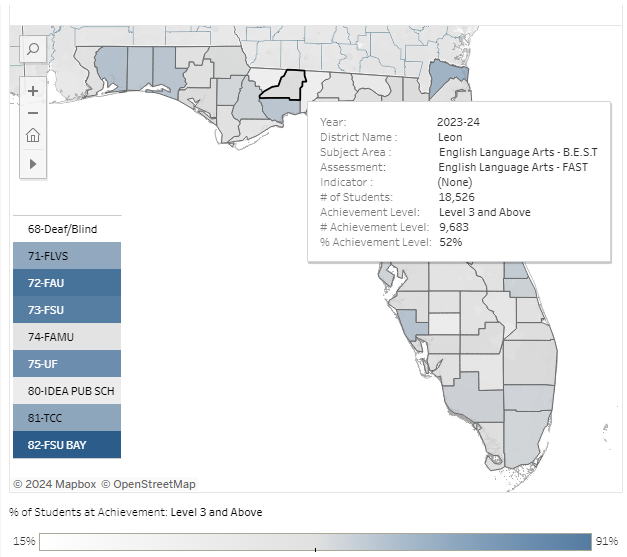
Map Tool Tips
Tooltips: Hover over the map to view additional information. This feature assists users with navigating the interactive features of the map.
- Hover over an individual district to show the tooltip that reflects the district’s name, selections made in the left-hand navigation, and the associated number/percentage.
- District Map Filter : Click on a district in the map to filter the data for a specific district.
-
Reset Map: Use the Home button in the toolbar to return the map to its original setting.
- Tooltips: Hover over the map to view additional information. This feature assists users with navigating the interactive features of the map.
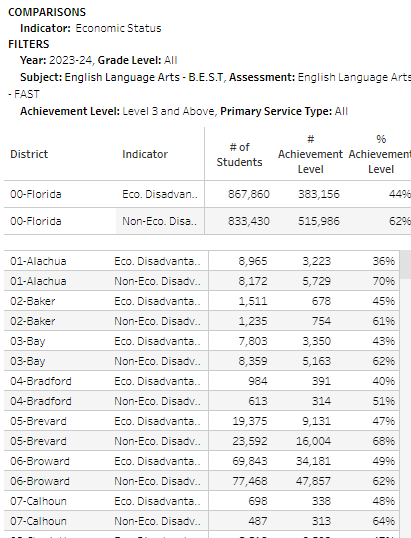
Map Tables
Data tables are included beside the maps providing the number and/or percentage of students reflected in the maps. These data tables also respond to selected filters and comparison indicators.
Blank Maps, Charts and Tables
A blank screen will display when a user selects a combination of filters and indicators in which no data exists. For example, the Mathematics- FS Assessment was last administered in the 2021-22 school year. If a user selects a year filter after 2021-22 for this assessment, a map will not appear.
Build A Table
The Build A Table feature allows users to select filters and indicators and download a custom table that focuses on the user’s interests.
Table Expansion and Minimize Buttons
Table headers contain expansion (+) and minimize (-) buttons that are visible when hovering over the headers. If present, these buttons allow users to drilldown and collapse to the next or previous level of data.
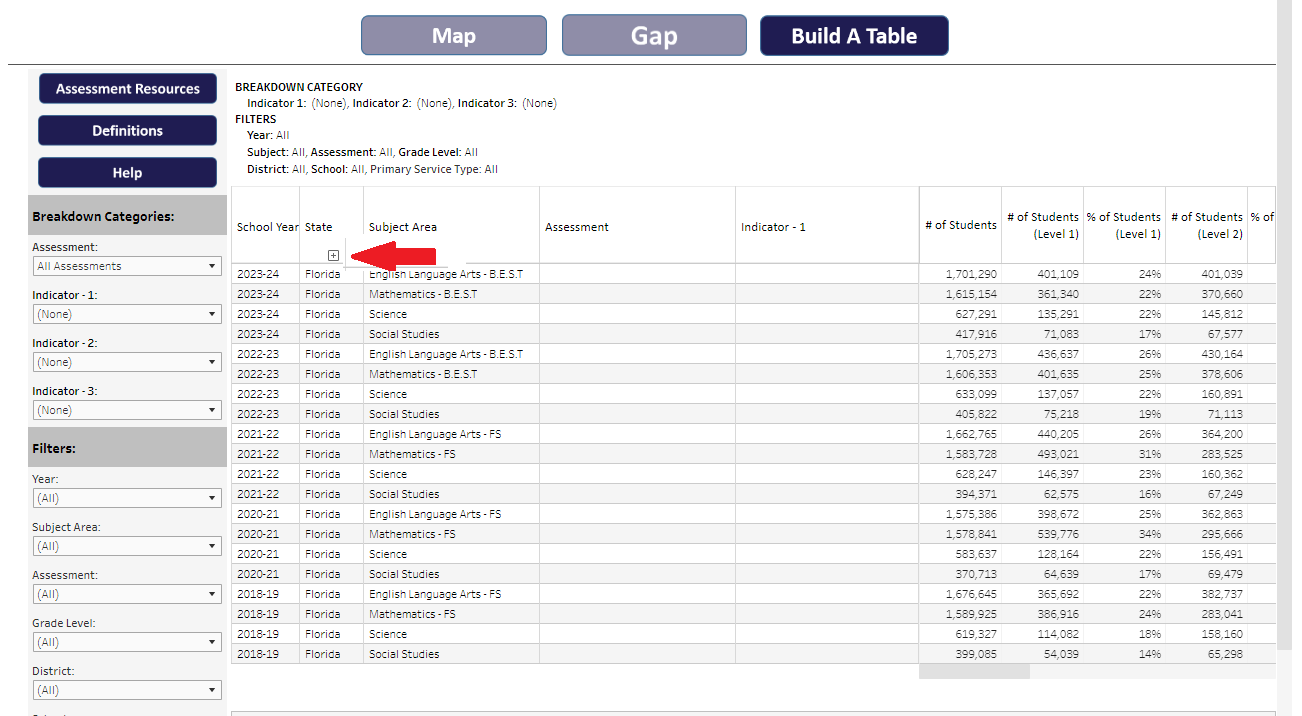
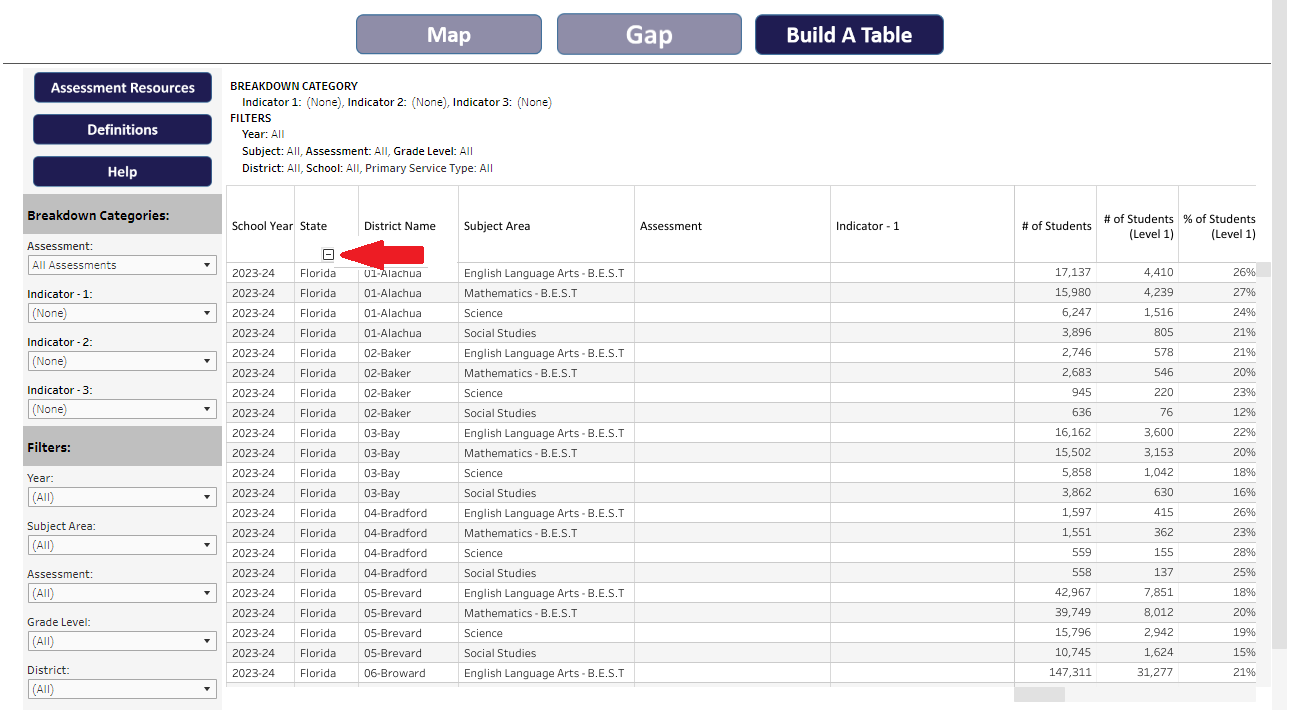
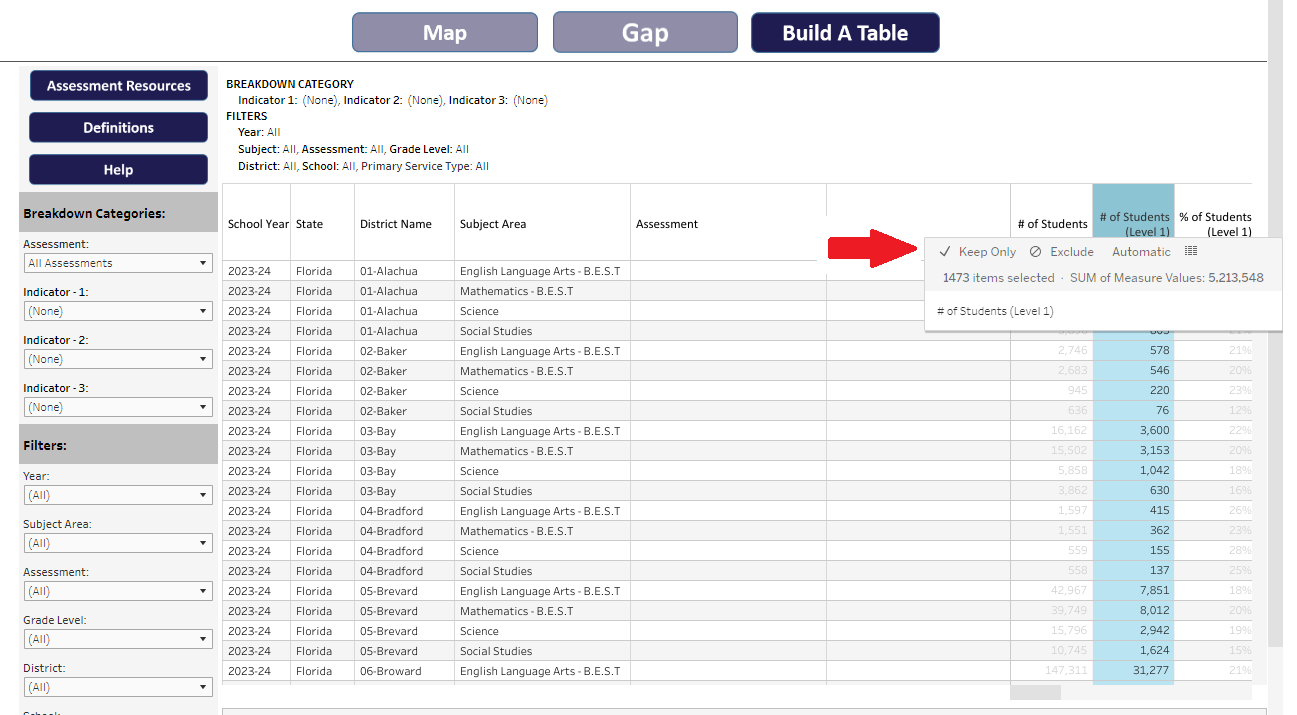
Table Exclude and Keep Only Feature
Each report provides preset data based on the indicators selected. Users may further tailor reports to their needs by excluding or keeping certain data measures.
- Hover over a specific column header to select Exclude and remove the column or Keep Only to remove all other columns of data.
-
Use one of the following options to revert a change make to a chart or table:
- Undo button: Select this option to go backwards one step at a time.
- Revert button: Select this option to remove all changes and revert the view to its original state.
Table Filters
- District and School Filters: When applying a District or School filter, it is important to expand the State column to display and download the District Name and School Name columns. These columns will display the selected filters in the table. See the Table Expansion and Minimize Buttons section for more information.
- Grade Level Filter: When applying the Grade Level filter, it is important to select the Grade Level Indicator to display the selected grades in the table.
-
Use one of the following options to revert a change make to a chart or table:
- Undo button: Select this option to go backwards one step at a time.
- Revert button: Select this option to remove all changes and revert the view to its original state.
Downloading Data
Download in Excel
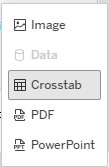
Download the underlying data in maps, charts, and tables using the Download button  located at the top or bottom of the page. Download options include Image, Crosstab, PDF, or PowerPoint. Users will need to download multiple reports if there are nested tables (e.g., a state report and a district report).
- Download in EXCEL: Using the Crosstab option will download the data and open in an EXCEL workbook.
Important Data Download Notes!
- The * used to indicate masked data will not download in EXCEL. These cells will appear as blank cells; therefore, it is important not to use the EXCEL Sum feature to represent the total number of students. Always use the expansion (+) and minimize (-) buttons in tables and download state-, district- and school-level data separately.
- Filters applied during a table creation are not included in the crosstab download. It is recommended that you screenshot the table title when downloading a table and paste the screenshot into your EXCEL sheet for future reference.
- District and School Filters: When applying a District or School filter, it is important to expand the State column to display and download the selected District Name and School Name columns. See the Table Expansion and Minimize Buttons section for more information.
- Grade Level Filter: When applying the Grade Level filter, it is important to select the Grade Level Indicator to display and download the selected grades in the table.
Helpful Resources
Each report has links to assist users with common terms and/or calculations used in the reports.